Slow Server
Every till talks to your WordPress site all day: it checks for changes, sends sales and fetches what a cashier looks up. How fast your server answers sets how fast the POS feels. When your server struggles, each till slows its own checks down and recovers by itself. This page shows where to see that happening, what it means and what to change on your hosting.
Here because of something you saw?
- Easing off or Paused until … under Your server, over time. You can keep selling: only background checks slow down, so changes from other tills may take longer to appear. If it shows most days, choose a lighter preset first.
- A 503, 429 or 414 error. Each code has a short answer first; the detail for your website maintainer is folded away below it.
- Searches and sales are slow on every till. Easing off never slows them, so look at your server first, not the tills: pass what to send your host to whoever looks after your website.
See how your server is coping
Open Store health from the pulse icon at the foot of the menu, then Performance. The figures are for this till only.
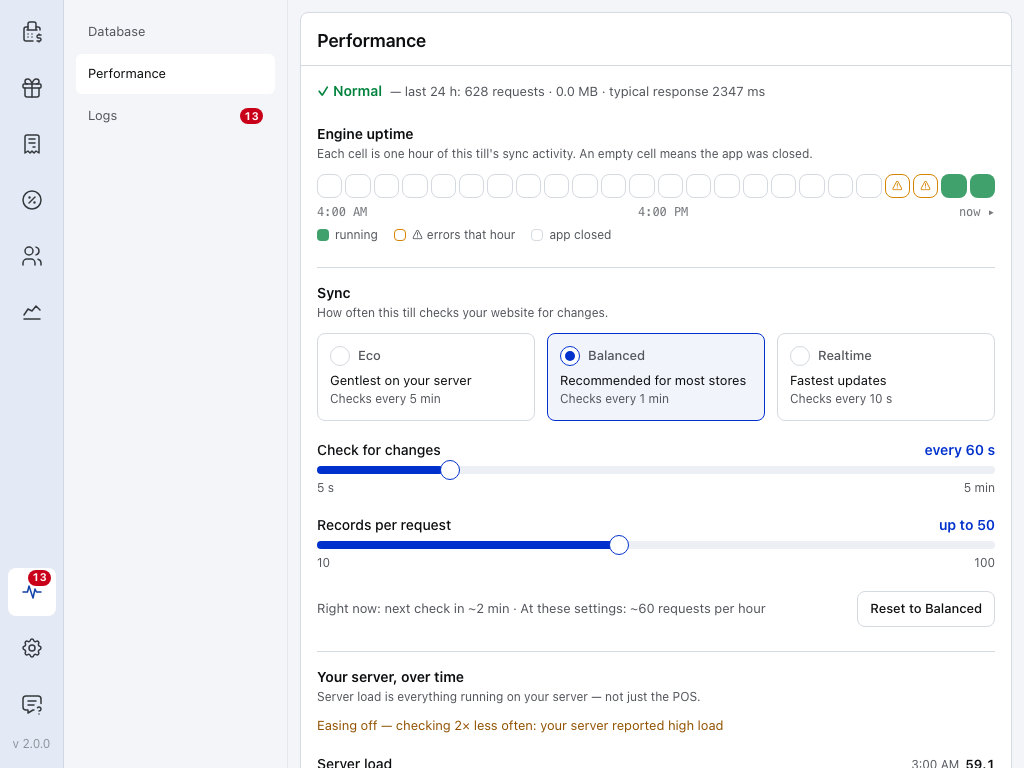
- Store health — the pulse icon at the foot of the menu.
- Performance — how often this till checks your store, and how your server is coping.
- Last 24 hours — Normal means this till is online and syncing right now. Then requests, data and typical response in milliseconds: 2347 here is about 2.3 seconds. If it stays over 2000 most days, include it in what you send your host.
- Engine uptime — one cell per hour. Amber means at least one request failed that hour. Hover over or tap a cell for its counts.
- Eco — the gentlest of the three presets, beside Balanced and Realtime. Choose it on tills that don't need to see other tills' sales quickly, and don't choose Realtime unless whoever looks after your website says to. See Sync presets.
- Right now — when the next check is due. The requests an hour are the regular checks your settings ask for; while the till eases off it makes fewer, which is why the next check here is ~2 minutes away.
Read "Your server, over time"
Scroll down the same tab. Your server, over time says what pace the till is keeping and charts the last 24 hours.
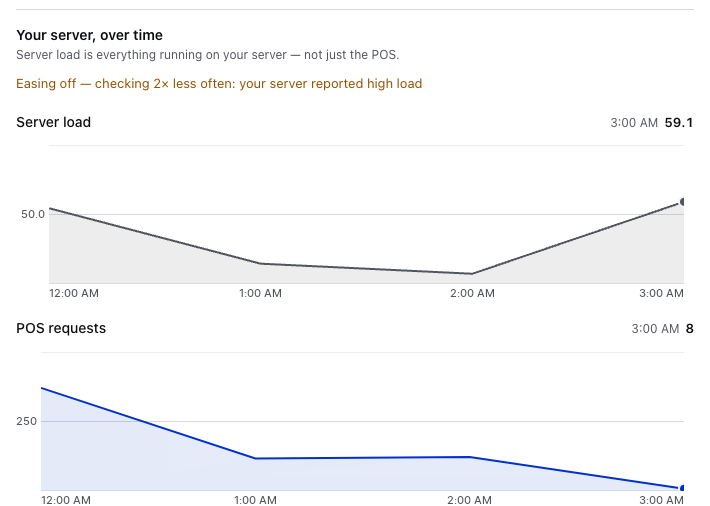
- Your server, over time — server load counts everything running on your server, not just the POS: the website, backups, other sites on the same host.
- Pace — here Easing off — checking 2× less often: your server reported high load, in amber. This till checks every 2 minutes instead of every minute, and goes back by itself once your server recovers. See What the pace line means.
- Server load — the busiest load your server reported in each hour. The figure beside the title is the latest hour's. You don't have to judge the number: the pace line says when your server calls it elevated or high.
- POS requests — every request this till sent your store in each hour: the regular checks, plus downloading changes, sending sales and searches. That is why it can run well above the requests an hour your settings ask for.
Read the two charts together. If load rises and falls with the POS requests, the tills may be part of it. If load rises on its own, something else on your server is busy: the website, a backup, another site on the same host. In this shot both lines drop together after midnight; after 2:00 AM the load climbs to 59.1 while this till's requests keep falling, so something else is busy, and the till has eased off to spare it.
Either way, a screenshot of both charts is what your host needs to see. If the typical response is slow while the load stays low, your server isn't short of power: look at order storage and your plugins first (steps 2 and 3 of When your server keeps struggling).
If the charts are empty
Both charts read Not enough data yet — this trend fills in as the till runs until the till has readings from two different hours. Leave the till running and look again later.
What the pace line means
The line reads one of these. It is separate from the Normal status at the top of the tab, which can stay Normal while the till eases off.
- Normal pace — the till checks at your setting.
- Normal pace — your server reports elevated load (or high load) — your server says it's busy, and the till is still at your setting: one busy answer doesn't slow it. The till also eases off under sustained load: when most of its last ten answers report high load, the line changes to Easing off, even if those answers came back fast (see What each reason means). Nothing to do unless it shows most days.
- Easing off — checking N× less often: … — the till checks less often, and names the reason after the colon. See What each reason means below.
- Paused until … — your server named a time to come back, and the till waits until then. You can keep selling while it waits.
The line changes colour while the till is easing off or paused. Both clear by themselves once your server recovers. If they show most days, see When your server keeps struggling.
Only the till's regular check for changes, and its background checks, slow down. A search, a barcode lookup or a sale goes to your server straight away. While it eases off, this till takes longer to see changes made on other tills and in WooCommerce.
What each reason means, by how much the till slows, and how it recovers
- your server asked the POS to slow down — your server, or a firewall in front of it, answered "too many requests" (429) once.
- your server returned errors or requests to your server timed out — three server errors (5xx) or timeouts within a minute. The reason names the last of the three.
- your server was answering slowly — the typical (median) answer time over the last ten answers was more than two seconds.
- your server reported high load — most of the last ten answers said your server is under high load while the till was at its normal pace, or two load readings in a row were at least double your server's usual load, once the load is 1 or more.
Each time, it checks half as often as before. It never goes slower than once every 5 minutes, or twice your setting when that's longer: every 10 minutes on Eco. A server that names its own pause (a Retry-After header) gets it, up to 15 minutes.
Recovery is slower on purpose: ten good answers, at least a minute after the last slowdown, halve the wait again. A load jump is the exception: the till checks half as often, never slower, until two load readings in a row are back within a quarter of your server's usual load. A till that restarts goes back to your setting.
WCPOS itself asks for short pauses: 5 seconds while the plugin is being updated on your site, 30 seconds while its sync tables are being installed. You may see Paused until … for a moment then.
For the engine rules behind this, see Sync Performance.
Where the load figures come from
Your server reports its load average with every sync answer: how many processes were running or waiting for a processor, averaged over the last minute. Compare it with your server's number of processor cores. A load of 4 on a 4-core server means it's fully busy; on a 16-core server it's light.
The elevated and high words work this out for you. WCPOS divides the load by the core count: under 0.9 per core is low, up to 1.8 is elevated, above that is high. On shared hosting the figure counts every site on the machine, not just yours.
Your server doesn't report its load. Everything else on this page still works. appears in place of the chart when PHP can't read the load average. That's normal on Windows servers and on hosts that switch the function off. The pace line still works without it, because the till also watches errors and answer times.
When your server keeps struggling
Work down this list. Each step is cheaper than the next. Anyone at the till can do step 1. Steps 2 to 4 are for whoever looks after your website: the store owner, a developer or your host.
- Choose a lighter preset. On tills that don't need to see each other's sales within seconds, open Store health › Performance and choose Eco. Don't choose Realtime unless whoever looks after your website says to. The preset is saved per till. See Sync presets.
- Switch WooCommerce to HPOS if it still uses legacy order storage. It's the biggest single gain on a store with many orders. While the store is on legacy storage, a warning at the top of POS → Settings → Checkout in WP Admin says so, with a link to WooCommerce's setting. See Order Storage (HPOS).
- Look for the plugin that's slowing every request. Test on a staging site with only WooCommerce and WCPOS active, then switch plugins back on one at a time. See Plugin Conflicts.
- Ask your host for object caching (Redis or Memcached), more PHP workers and memory, or a move off shared hosting. See What to send your host.
What to send your host
Contact your host or a WordPress developer when Easing off or Paused until … shows most days, the typical response stays over 2 seconds, or your host's logs show memory errors.
From the till, send:
- A screenshot of Store health → Performance, scrolled to Your server, over time.
- The debug report from Store health → Logs → Copy debug info (Share debug info in the phone and tablet apps). It already names your WordPress, WooCommerce and WCPOS versions. See Logs.
From whoever looks after your website, add:
- The list of active plugins, from Plugins in WP Admin.
- Your server's specification: cores, memory and storage type, from your hosting account.
The rest of this page is for whoever looks after your website. If you came for a 503, 429 or 414 code, Errors your server sends gives each one a short answer first.
Server requirements
WCPOS installs on any site that meets the plugin's minimums: PHP 7.4, WordPress 5.6 and WooCommerce 9.0. A store selling every day needs more; the figures to send your host are below.
Server requirements to send your host
For a store selling every day, we recommend at least:
Shared hosting usually has too few PHP workers and too little memory for several tills checking at once. For a store selling every day, use a VPS or a managed WordPress host. WordPress.com hosting has had REST API problems, such as only 9 or 10 products loading from a large catalogue; self-hosted WordPress avoids them.
The stack stores report as fastest
Store owners report the best POS speed with this combination:
- MariaDB 11.4
- HPOS for orders (Order Storage)
- Redis or LiteSpeed object caching
- NVMe storage
- PHP OPcache on
Errors your server sends
503 Service Unavailable
Your server, or something in front of it, couldn't handle the request. The till's background checks back off and try again by themselves. A short 503 is normal while WCPOS is being updated on your site or installing its tables: the till waits 5 to 30 seconds and carries on. If it keeps happening, pass what to send your host to whoever looks after your website.
For your website maintainer: what to check on a 503
Check the server's load and free memory, whether its PHP workers are used up, and that PHP's memory limit is 256 MB or more. Your host's error logs show what the POS can't.
429 Too Many Requests
Your host or firewall limits how often one address can call your site. The till eases off at once and tries again later. Several tills behind one shop router share one address, so choose Eco on tills that don't need to see other tills' sales quickly. If it keeps happening, pass what to send your host to whoever looks after your website.
For your website maintainer: allowing the POS more requests
Ask your host, or the firewall's settings, to allow more requests from the shop's address to /wp-json/, the path the POS calls.
414 URI Too Long
You see it on a payment page under the checkout's Legacy tab. That page opens with your sign-in in its address, and your server's limit on address length is too short. Ask whoever looks after your website, or your host, to raise it.
For your website maintainer: raising the address limit
- Apache:
LimitRequestLine 65536inhttpd.conf - Nginx:
large_client_header_buffers 4 65536;innginx.conf
Update WooCommerce safely
A WooCommerce update can occasionally break the POS. Update WooCommerce on a staging site first, and keep WCPOS up to date so it has the latest compatibility fixes. WCPOS 2.0 needs WooCommerce 9.0 or later.
If an update breaks the POS, tell us on Discord, and ask whoever looks after your website about going back. An update can change your store's database, so they should check that first and have a backup from before the update.
For your website maintainer: going back to an earlier WooCommerce
The Advanced View link on WooCommerce's WordPress.org page lists previous versions. Restore from the backup taken before the update when the update changed the database; otherwise install the version you had before. Try it on staging first.
Order storage (HPOS)
WooCommerce's High-performance order storage keeps orders in their own tables instead of among your posts. On a store with many orders, saving a sale is much faster with it. Check which storage your store uses, and switch with WooCommerce's own tool: Order Storage (HPOS). WooCommerce's guide is High-Performance Order Storage.
PHP and WordPress settings to ask your host about
These are starting points, not rules. Your host knows what its servers allow.
memory_limit = 512M
max_execution_time = 300
max_input_vars = 3000
In wp-config.php, keeping fewer post revisions keeps the database smaller:
define('WP_POST_REVISIONS', 3);
Plugins that often slow every request: heavy SEO plugins running on product saves, complex inventory systems, real-time analytics and tracking, and custom code hooked into WooCommerce. Find yours with Plugin Conflicts.
Hosting-specific notes
Some hosts and CDNs need a change before the POS can reach your site's REST API. Open yours:
GoDaddy
The website firewall blocks /wp-json/, with errors like "Received 'undefined'". In Website Security › Firewall › Settings › Access Control › Allow URL Paths, add /wp-json/.
WP Engine
The REST API has to be switched on. Switch it on, and allow its paths in the WP Engine firewall if needed.
Cloudflare
Bot Fight Mode, Under Attack Mode or WAF challenges block REST requests, and the cache can serve stale answers. Follow the Cloudflare guide to add a WAF Skip rule and a Bypass cache rule for /wp-json/.
WordPress.com
Products can fail to load, such as only 9 or 10 showing from a large catalogue. Use self-hosted WordPress.
Shared hosting
Too few PHP workers and too little memory for several tills. Move to a VPS or a managed WordPress host.
Security plugins such as Wordfence can block the REST API the same way. See Plugin Conflicts.