Reports
Reports shows what a till, a store or every store sold over a period: the total and how it compares, then cards for payments, products, cashiers, taxes and refunds. Open it from Reports in the side menu. Everything is worked out on the device from the orders it has downloaded.
- Reports opens on today, for every register in your store (on the free plugin, this device's register). For anything else, choose the period, then the store and register.
- Read the sales: the total and how it compares.
- For more detail, scroll down to the cards and tap a card's arrow to open its panel.
On the free plugin, Reports shows today on this device's register. WCPOS Pro opens earlier days, other registers, every store and the closures history.
Choose the period
Open Reports and tap the period at the top to open the presets and the calendar.
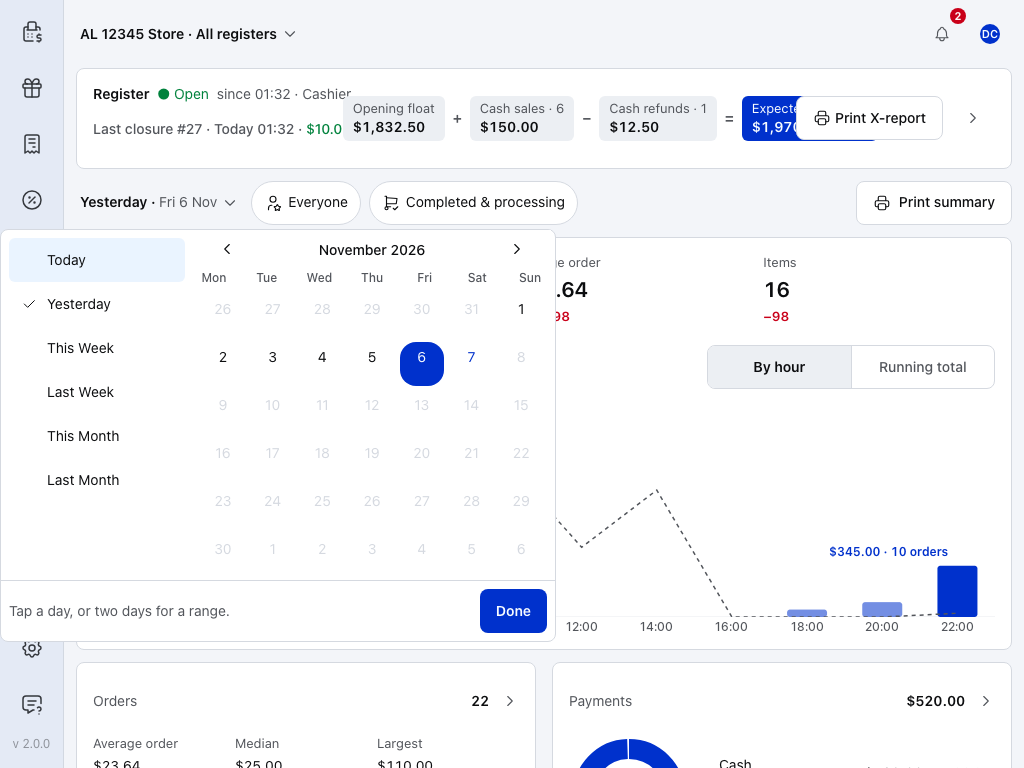
- Today and Yesterday — one day, compared with the day before or the same weekday last week.
- This Week and Last Week — a calendar week. This Week stops at today.
- This Month and Last Month — a calendar month. This Month stops at today.
- Calendar — tap a day for that day, or two days for the range between them.
- Done — applies the days you tapped.
If a period is locked
On the free plugin, every period but Today carries a lock. Tapping one shows Earlier days are in WCPOS Pro with a See Pro button.
Choose the store and register
Tap the store and register name at the top.
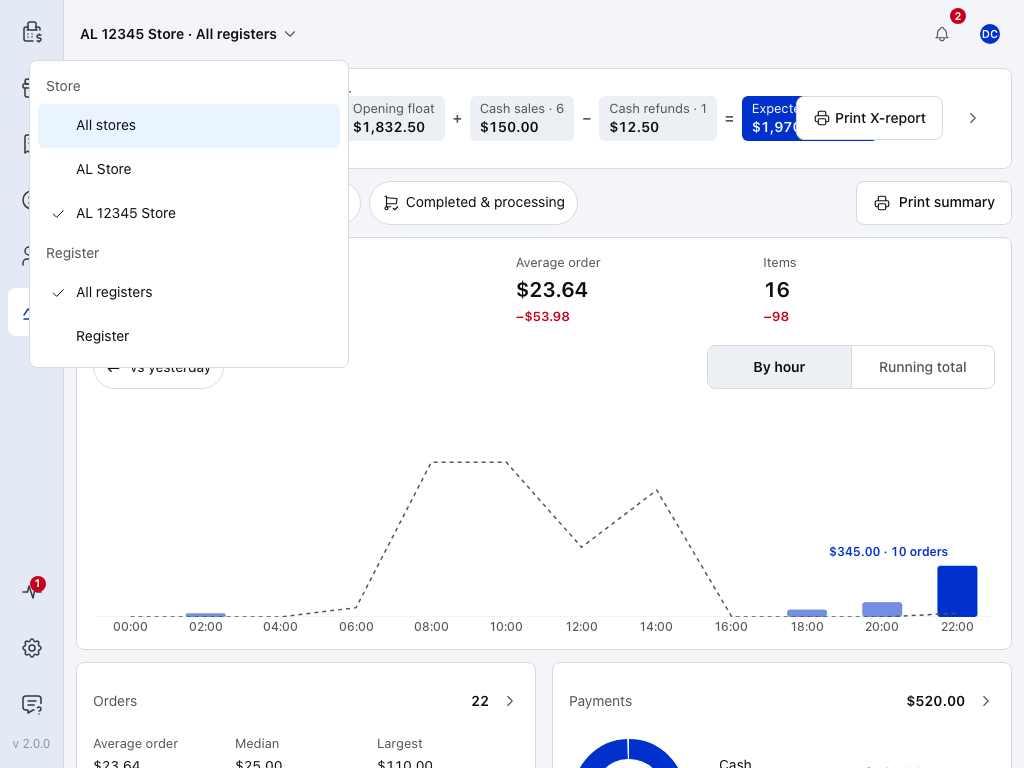
- All stores — every store in one report. It appears only with more than one store.
- A store — one store's sales.
- All registers — every register in the store, and orders taken online.
- A register — one till's sales.
If a store or register is locked
On the free plugin, the store and register you're signed in to are the only ones you can open. The others carry a lock, and choosing one shows Other registers are in WCPOS Pro (or Other stores, or All stores) with See Pro.
Two buttons beside the period narrow the figures further. Tap Everyone to choose a cashier from those who have signed in on this device. On the Cashiers card, a cashier who never has shows as a number, such as #8. Tap Completed & processing to choose Every status instead.
On a phone, the period and a print button share the top line, and Everyone and Completed & processing sit below them in two columns. An orders left out button joins them when you leave orders out.
Read the sales
The top of the screen answers "how did we do?" for the period, the store and the register in the bar. The total is every payment method, tax included, before refunds. It isn't the cash in the drawer: that is the till strip's Expected in drawer.
Wait until Downloading orders at the top disappears before using the figures. It shows when the period holds more orders than the device has, with a count of those downloaded so far.
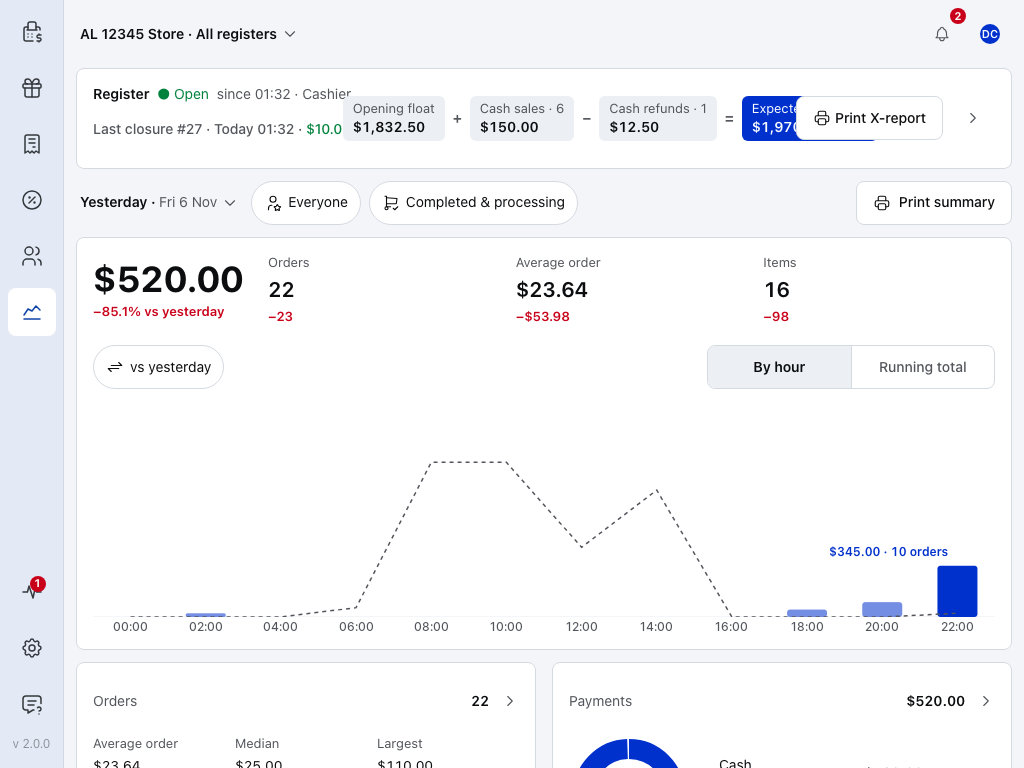
- Store and register — the store and register the figures cover. See Choose the store and register.
- Till strip — this device's register session: Open or Closed, and the cash Expected in drawer. It stays the same whatever store, register or period you choose. See The till strip and closures.
- Period — the days the figures cover. See Choose the period.
- Cashier — Everyone, or one cashier's sales.
- Status — Completed & processing counts the orders that are sold. Every status adds pending and on hold orders.
- Print summary — prints a Sales summary of the period. See Print or export.
Under the chips are the figures and the chart.
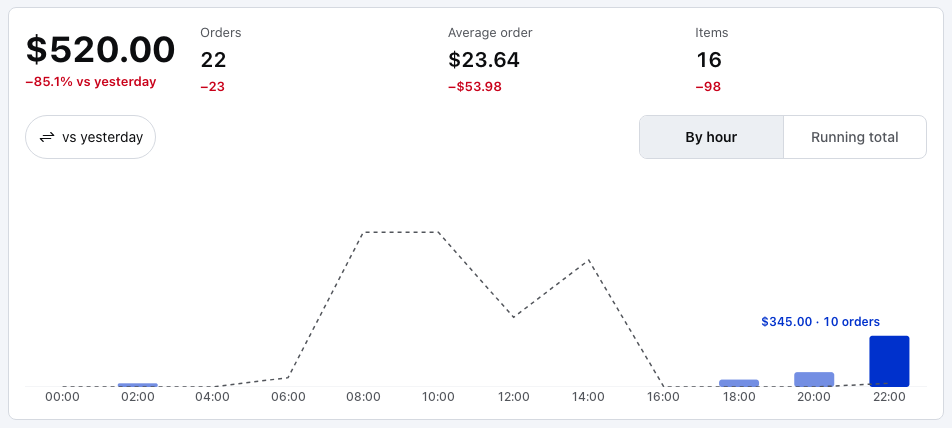
- Total — the sales for the period, tax included, before refunds (the Refunds card shows what you kept). It is every payment method, not the cash in the drawer. Under it is the change against the comparison, as a percentage. Red is down, green is up.
- Orders, Average order, Items — each with its own change against the comparison. A — means there is nothing to compare with.
- Comparison — what the changes are measured against. For a single day, choose vs yesterday or vs last and the weekday. See How comparisons work.
- Chart — By hour for a day, By day for longer periods, or Running total to watch the period add up. The dashed line is the period you compare with.
How comparisons work
The comparison chip under the figures names the period the changes are measured against. A day is compared with yesterday or the same weekday last week, a week with the week before, and a month with the month before.
How comparison periods are calculated
- A single day is compared with yesterday or with the same weekday last week, whichever you choose on the comparison chip.
- Today is a live day, so it is compared at the same time of day: at 3pm, with yesterday up to 3pm.
- A week, or any range of two to seven days, is compared with the same days a week earlier. The chip reads vs the week before and can't be changed.
- A whole calendar month is compared with the whole month before. This Month, and any range longer than seven days, is compared with the same number of days starting a month earlier. The chip reads vs the month before.
- A — under a figure means the comparison period has no orders.
Read the cards
Scroll down for the cards. Each one opens a panel with the full list.
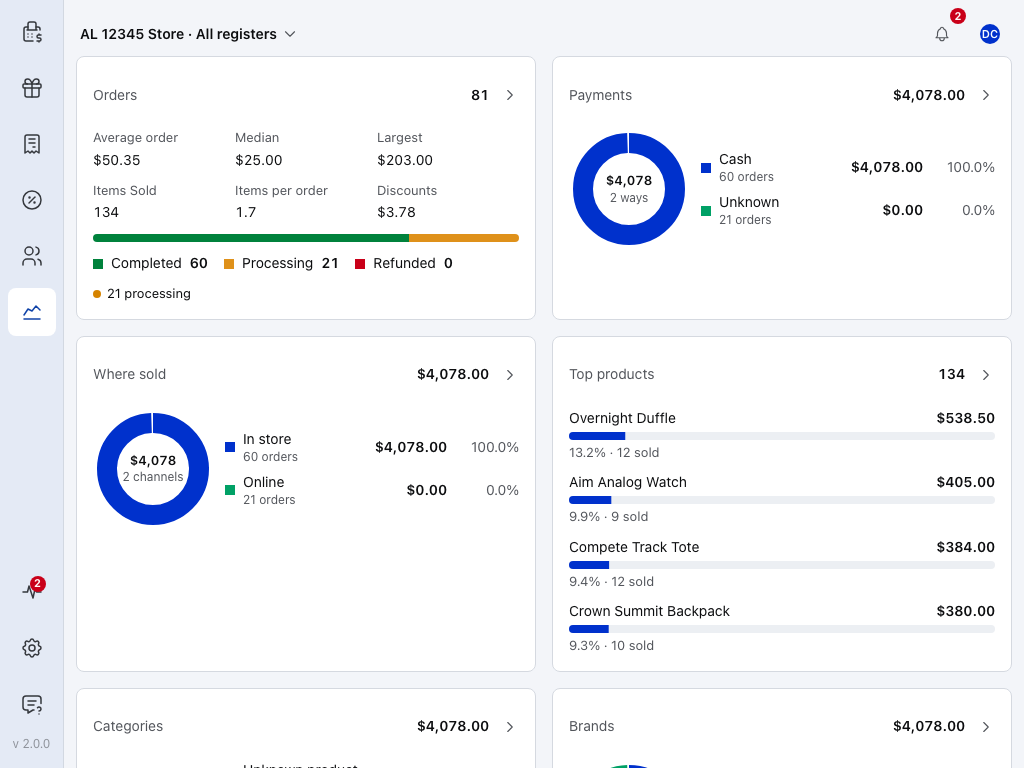
- Orders — what a typical order looks like, then a bar of Completed, Processing and Refunded orders.
- Needs you — how many orders are still processing, on hold or pending. Nothing needs you when none are.
- Payments — sales by payment method, with each method's share. UNPAID is money an order still owes. Unknown is an order that records no payment method.
- Where sold — In store against Online. Switch it to Registers when the figures cover more than one register, or to Stores when you chose All stores. An order with no register reads No register.
- Top products — the best sellers by sales, with each one's share and how many sold.
What the order figures mean
- Average order — sales divided by orders.
- Median — the middle order total, with half the orders below it.
- Largest — the biggest order.
- Items Sold — how many items the orders held.
- Items per order — items sold divided by orders.
- Discounts — the discounts given.
Further down:
- Categories — sales by product category.
- Brands — sales by brand.
- Cashiers — sales per cashier.
- Taxes — tax per rate, each on the net sales it was charged on.
- Refunds — the refunds made in the period: how much, how many orders they were on, and how much of the period's sales you kept. A refund counts in the period it was made, even when the order is older.
Missing products, categories or brands
- Uncategorised on the Categories card is a product in no category.
- Unknown product is a line whose product isn't on this device, so it can't be given a category. A note says how many lines that is, such as 58 of 117 lines have no local product. The sales still count in the total.
- No brand on the Brands card is a product with no brand. The Brands card appears only when your products carry brands, or when the store tracks cost of goods.
Open a panel
Tap a card's arrow. On a tablet the panel slides in from the right, over the report, with the side menu still beside it. On a phone it opens as its own page, and Sales at the top takes you back.
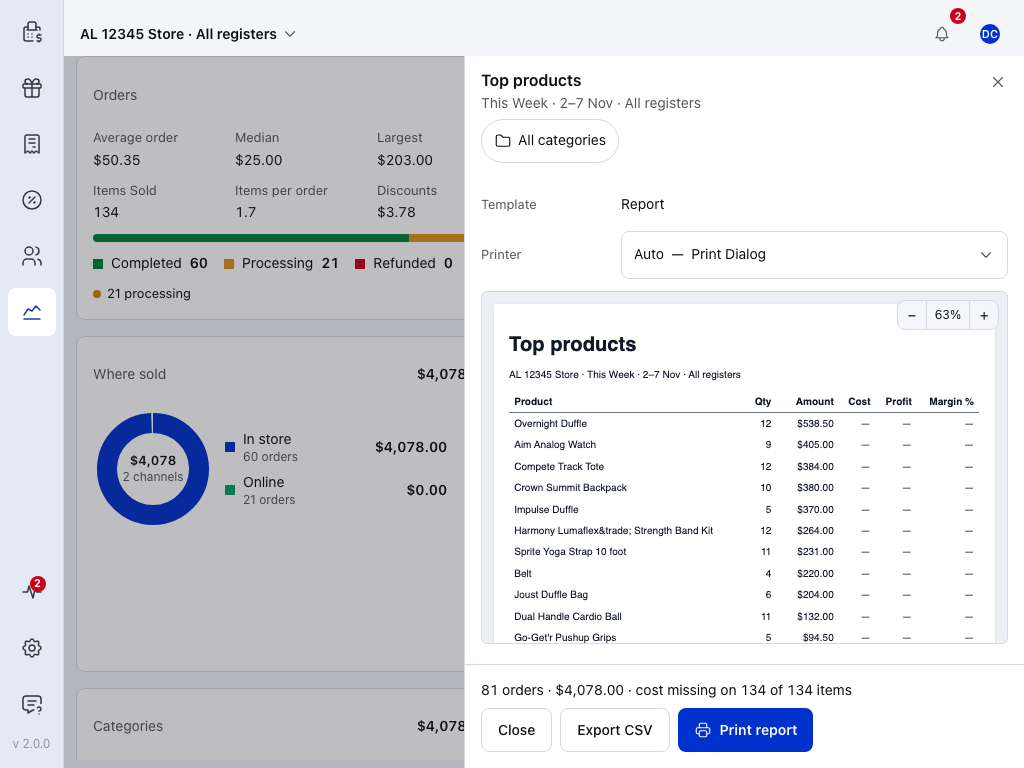
- Period and register — what the panel covers.
- Filter — Top products narrows to one category (All categories), Sales by brand to one brand.
- Status line — the orders and the total. With cost of goods on, it also says how many items have no cost. See Cost, profit and margin.
- Export CSV — saves the list as a CSV file. In a browser it downloads; in the app it opens the share sheet.
- Print report — prints the list with the Template and Printer shown above the preview.
The panels are Orders, Sales by payment method, Top products, Sales by category, Sales by brand, Sales by cashier, Taxes collected (net, tax and gross per rate), Refunds, and Channels, Registers or Stores from Where sold.
Leave orders out
A test sale or a staff purchase can skew the day. Open the Orders panel and untick the orders to leave out.
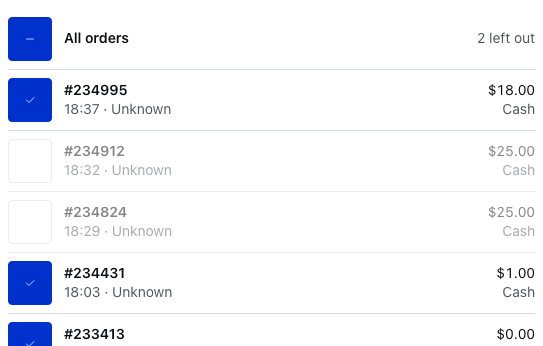
- All orders — ticks or unticks every order. Beside it, how many are left out, here 2 left out.
- An order — untick it to leave it out. It greys out, and the panel's footer reads 36 of 38 counted · the numbers follow.
Each row shows the order number, the time and cashier, the total and the payment method. The panel lists the 60 most recent orders, then says how many more there are. To reach an earlier one, narrow the report first: a shorter period, one register or one cashier. The report's figures and cards are worked out again without the orders you left out. The till strip stays as it is.
An orders left out button next to the status then reads, for example, 2 orders left out. Tap it to get back to the Orders panel, or tap its × to count them again. Leaving an order out only changes this report on this device: the order itself is untouched. Untick every order and the Orders card reads Every order is left out.
Print or export
- Print summary at the top prints the Sales summary for the period: sales (net, tax, refunds and discounts), payment methods, taxes, shipping, then stores, registers and cashiers when there is more than one, and items sold and the average order. Any orders you left out stay out.
- Print report in a panel prints that panel's list.
- Export CSV in a panel saves that list.
Printing uses your receipt templates and the printer you chose.
If printing waits or fails
- Still loading. While the report or a template is on its way, the print sheet says so: Waiting for the store, Loading the report, Still loading orders for this range, Still loading refunds for this range or Loading templates. You can print once they are in.
- No template can print offline · manage templates in WP Admin. This device holds no template it can print offline. Templates are managed in WP Admin.
- The saved printer cannot print this template. The template and the printer don't match: pick another printer in the sheet.
- "Could not print. Try again." or "Export failed. Try again." Try again. If printing keeps failing, check the printer in the sheet.
Cost, profit and margin
When your store tracks cost of goods, the Top products, Sales by category and Sales by brand panels add Cost, Profit and Margin % columns. A product with no cost shows — there, and the status line says how many items are missing one, such as cost missing on 3 of 40 items, so you know how far to trust the margin.
The till strip and closures
The till strip shows this device's register: Open or Closed, since when and who opened it, and the drawer sum Opening float + Cash sales − Cash refunds = Expected in drawer. Paid in and Paid out join the sum when the session has any. Print X-report prints the open session; a closed register offers Print closure instead. A device with no register reads No register on this device.
With WCPOS Pro, the arrow at the end of the strip opens Closures: every numbered closure of the registers you can see, to reprint, recount or check. Export CSV there saves the closures listed. Export closures under Tools in WP Admin > POS > Settings downloads every closure. The day's procedure is in Reconciliation.
Longer ranges in WooCommerce Analytics
For order-level exports or any date range, use WP Admin > WooCommerce > Analytics. It reads the same orders. With WCPOS Pro:
- The Orders report's order-type filter adds POS Orders and Online Orders.
- The Revenue report adds Store, Cashier and Payment Method filters, each once there is more than one.
If something goes wrong
"Report access is not permitted". Your user doesn't have the view reports capability. See Access.
The figures look low. Check the status button: Completed & processing leaves out pending and on hold orders. Check for an orders left out button, then the store, register and cashier.
A product shows as Unknown product. That product isn't on this device, so its line can't be given a category. The sales still count in the total.
A cashier shows as a number. That cashier has never signed in on this device. The sales are theirs; only the name is missing.
A print waits or fails. Open If printing waits or fails under Print or export.
Pro opens earlier days, custom ranges, other registers, All stores and the Closures history. See Free vs Pro.