Sync Performance: How the POS Protects Your Server
To set how hard a till works your server:
- Open Store health from the pulse icon at the foot of the menu.
- Tap Performance.
- Leave Balanced selected: it is the default. If your server regularly struggles, and the pace line often reads Easing off or Paused until …, tap Eco instead.
The setting is saved on this device only, for the store it is on, so set each till. The presets are compared in What syncing costs your server.
Understand the Performance messages
Four things the Performance tab can show. The first two need action; the last two are normal.
Easing off or Paused until … most days — choose Eco, then check your server
Your server is regularly turning the till away, returning errors or answering slowly, and the pace line says which. Choose Eco on each till, and see Server Performance for hosting, plugin, firewall and slow-response checks.
⚠ Needs attention — check this till's connection and sync jobs
The till is offline, sync is blocked, a first download failed, or a sync job's last run failed. See Store health.
Your server doesn't report its load — the other readings still work
Nothing is wrong. The pace and the request counts still work.
0.0 MB next to many requests — sizes your server doesn't state count as 0
Your server doesn't state the size of its answers, so they count as 0. See What the numbers don't tell you.
The Performance tab, and what sits behind it
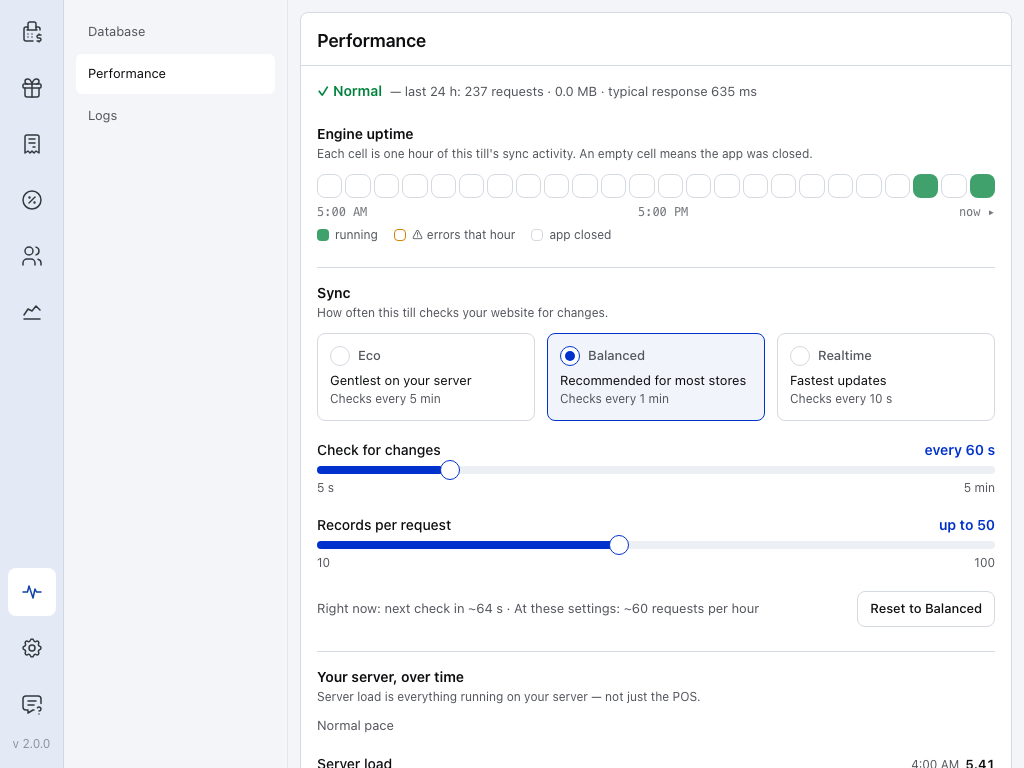
- Last 24 h — every request this till made for this store, the data it received and its typical response time. The data figure is a floor: see What the numbers don't tell you.
- Engine uptime — one cell per hour. Amber means at least one request failed that hour, which also feeds backing off.
- Eco — a check every 5 minutes, 25 records per request. See What syncing costs your server.
- Balanced — a check every 60 seconds, 50 records per request. The default.
- Realtime — a check every 10 seconds, 75 records per request.
- Check for changes — how often the till asks what changed, 5 seconds to 5 minutes.
- Records per request — how heavy each download page is, 10 to 100. This is usually what costs a shared server most: see Page weight.
- Right now — the next check, and about how many requests an hour the settings make. The figure is an estimate: see The requests-per-hour figure.
What syncing costs your server
Two settings set the steady cost: how often the till checks, and how many records it fetches per request.
- Eco — choose it when your server regularly struggles. A check every 5 minutes, 25 records per request.
- Balanced (the default) — choose it for most stores. A check every 60 seconds, 50 records per request.
- Realtime — choose it for the fastest updates, if your server has room to spare. A check every 10 seconds, 75 records per request.
- Custom — choose it to set the two sliders yourself.
Checks an hour, and the Custom ranges
Eco makes 12 checks an hour, Balanced 60 and Realtime 360, the most work for your server. Custom checks every 5 seconds to 5 minutes, in 5-second steps, with 10 to 100 records per request, in steps of 5: from 720 checks an hour down to 12.
Moving either slider makes the setting Custom; Reset to Balanced puts the default back.
Page weight
Records per request decides how much work each download is for your server. A page of 100 products can take seconds even on a fast server, and the check interval only multiplies that. So each preset moves both settings together, and no preset uses the 100-record maximum: it is there in Custom for servers you know can take it.
What keeps a quiet store cheap
A store where nothing changed costs little to keep in sync: its answers are empty, the tills' checks are spread out, and on fast settings a till nobody is using checks less often.
Empty answers, spread checks and idle tills, in detail
- An unchanged store answers with an empty reply. The till sends what it last saw, and the server replies
304 Not Modifiedwith no body. It still counts as one request. - Checks are spread out. Each wait is between 80% and 120% of your setting, so several tills don't all ask at the same moment. That's why the Right now countdown is rarely exactly your setting.
- A till nobody is using slows down, on settings faster than a minute. After 10 minutes with no tap, key press or barcode scan, it steps to a check every 30 seconds, then every 60 seconds. A hidden app goes straight to 60 seconds. Any use brings it back and checks at once, unless your server has slowed the till down. Balanced and Eco are already at a minute or slower, so they don't change.
Background maintenance
On top of the change checks, a few background jobs keep the till's copy complete and honest: they find records deleted on the server, and fill in what a till hasn't downloaded yet, so it can sell offline. Each run has a fixed ceiling: at most 11 requests, and the top-ups make 1.
Open orders are checked too. When the till starts, and every 5 minutes after, it asks your server about each open order it holds that is already saved there, at most Records per request orders to a request. An open order someone trashed or deleted in WP Admin then leaves the till; one with changes not yet sent to your server stays.
Every background job and its ceiling
| Job | Runs about every | Most requests per run |
|---|---|---|
| Deletion audit | 17 min | 11 |
| Deletion audit, till already in step | 17 min | summary pages only (at most 9), no detail requests |
| Fingerprints for records already on the till (100 IDs a request) | 15 min | 5 |
| Product top-up, one page in the order the product list is sorted | 5 min | 1 |
| Customer top-up | 5 min | 1 |
| Variation download | 5 min | 1 |
| Server totals for Store health (one count per request, fetched when stale) | 30 s checks | 11 |
How the deletion audit stays inside 11 requests
The audit compares the till's records with the server in buckets. It reads at most 9 summary pages (3 for each kind of record it checks), and skips every bucket whose summary matches. Only a bucket that differs gets a detail request, and at most 2 of those per run. If there is more to check, the audit saves its place and carries on next run, rather than catching up in one burst. Under server pressure a run drops to 1 summary page per kind and 1 detail request.
The requests-per-hour figure
At these settings: ~N requests per hour estimates how often this till checks for changes, worked out from Check for changes alone. It isn't a limit on all requests. The last 24 h count at the top of the tab is the real total.
Why the real count differs
Spreading moves the real count either way, a 304 still counts, an idle till on a fast setting asks less, and your server slowing the till down asks less again. Background maintenance and the cashier's own requests (searches, saving orders) come on top.
Four rules the engine follows
The costs above, and the slowdown below, come from four rules: cost follows what changed, background work has a ceiling, the cashier comes first, and under pressure background work gives way first.
How each rule works
Every till keeps checking your store for changes, so the POS treats your server's time as something to spend carefully. The rest of this page gives the numbers behind these rules, for store owners and developers; for a walk through the whole tab, see Store health › Performance.
- Cost follows what changed, not how big your catalogue is. Every check starts with a cheap question, and an unchanged store answers it with an empty reply. An unchanged 50,000-product store costs about the same to keep in sync as an unchanged 500-product store.
- Background work has a ceiling. Every background maintenance job declares the most requests it may make in one run, and the engine's tests fail if it makes more. Bigger jobs run in small batches and pick up where they left off next time.
- The cashier comes first. The requests that make a till ready to sell run first. Audits wait until the first page of products has downloaded, then a further minute. While the app is hidden or in the background, maintenance waits.
- Under pressure, background work gives way first. When your server struggles, the till checks for changes less often and puts off maintenance. Searches, barcode lookups and saving a sale are never held back.
Why your server's time is precious
Most stores run on shared hosting, where each request from a till starts WordPress from scratch, competes with your website's own visitors, and can trip a security plugin's rate limit. Every till adds its own checks on top.
Backing off when your server struggles
Every answer the till gets feeds a pressure check, one per website on this device. When it trips, the pace line under Your server, over time says so, with the reason. If Easing off or Paused until … shows most days, see Understand the Performance messages.
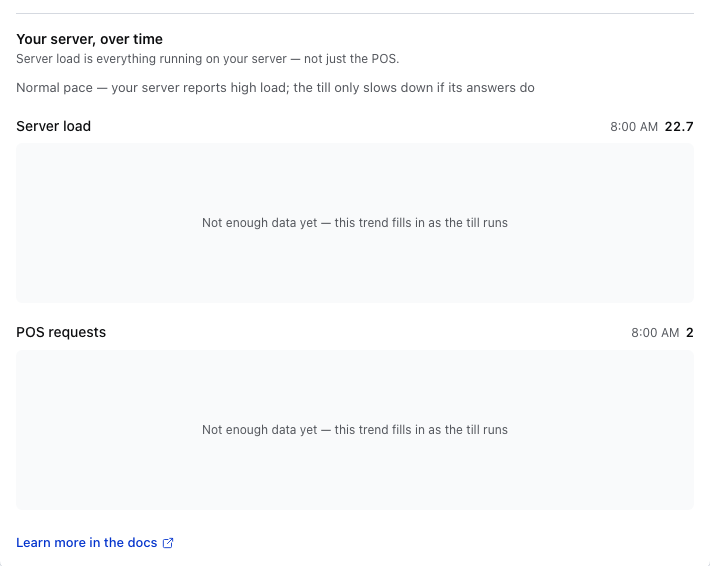
- Pace — what the till is doing about your server, shown close up below.
- Server load — the load your server reports, everything running on it and not just the POS. A server that doesn't send it shows Your server doesn't report its load, and the rest of the tab still works.
- POS requests — this till's requests, hour by hour, for the last 24 hours. Both charts read Not enough data yet until the till has run for a while, as here.
- Learn more in the docs — opens Store health › Performance in the docs.

- Pace line — Normal pace: leave your setting as it is. Your server reports high load but still answers quickly.
When the till does slow down, the pace line names the reason. Easing off — checking 2× less often is followed by one of these, and the number grows with each step:
- … your server asked the POS to slow down — your server turned a request away as one too many.
- … your server returned errors — several requests failed on the server within a minute.
- … requests to your server timed out — several requests got no answer in time.
- … your server was answering slowly — typical answers are taking more than 2 seconds.
- … your server reported high load — most recent answers came marked as under high load, or the load your server reports has doubled.
Paused until … — your server asked the POS to wait means your server refused a request and said when to try again. The till waits as asked, up to 15 minutes.
Errors while the device is offline don't count: that's your connection, not your server.
Exactly what trips each pace line
| Pace line ends | Your server | The till reacts |
|---|---|---|
| asked the POS to slow down | answers 429 Too Many Requests | at once |
| returned errors | returns 5xx errors | after 3 within a minute |
| requests … timed out | doesn't answer in time | after 3 within a minute |
| was answering slowly | answers slowly | when the middle of the last 10 response times is above 2 seconds |
| reported high load | marks its answers X-WCPOS-Pressure: high | on about 6 of the last 10 |
| reported high load | reports a load at least twice its usual level (and at least 1) | after 2 readings in a row, 2× at most |
| Paused until … | sends Retry-After with a refusal | at once, for up to 15 minutes |
A server that marks its answers elevated or high but still answers quickly shows Normal pace — your server reports high load; the till only slows down if its answers do, as in the close-up above (or elevated load at the lower level). The header can start a slowdown but never keep one going on its own: the till trusts how fast your server actually answers.
What slowing down means
- The till checks for changes less often. Each step doubles the wait between checks. How far it can slow depends on your setting: to about 5 minutes on Balanced and Realtime, and to 10 minutes on Eco. Custom settings and pauses are in the details below.
- Background maintenance waits. A job that has waited a long time still does one small run, unless your server has asked the POS to wait.
- The POS doesn't hold back what the cashier does. Searches, barcode lookups, opening a record and saving a sale are never held back by the slowdown, though a struggling server may still answer them slowly.
How far each setting slows, and which maintenance still runs
- Each step doubles the wait between checks, up to about 5 minutes: Realtime can slow 32×, Balanced 8×, and Eco 2× (to 10 minutes). A custom setting slows to 5 minutes, or to twice its own interval if that is longer. A
Retry-Afterpause can run past those limits, up to its 15 minutes. - Background maintenance waits. The background jobs hold off. A job that has waited twice its usual interval (the deletion audit and the fingerprint job, once) does one run anyway, within its ceiling, unless your server has asked the POS to wait. The deletion audit's run is cut to 1 summary page per kind of record and 1 detail request.
Coming back up
Once your server answers normally again, the till works its way back to your setting by itself, one step at a time (high load your server reports has its own rule, in the details below). You don't need to change anything. Slowing down is instant; speeding up is gradual, so a shaky server isn't bounced between fast and slow.
Presets, store switches, restarts and server load
- Each step back up takes 10 healthy answers in a row, and only once a minute has passed since the till last slowed down and no
Retry-Afterpause is running. From 32× it takes 50 healthy answers to get back to your setting. - Changing preset keeps the slowdown, cut down to the new preset's limit. You can't switch it off: it runs under every preset, including Custom.
- Switching store or cashier on the same website keeps it. Each website on the device has its own.
- Closing the app resets it. The till starts at your setting and slows again if your server is still struggling.
- Server load works on its own. When the load your server reports reaches twice its usual level (and at least 1) on two readings, the till checks half as often, until two readings fall back under 1.25 times its usual level.
Staying responsive on the till
Background sync must never make the screen stutter. Audits work in short chunks and pause so the screen can respond. In the engine's tests, the first results of a list still arrive in well under a tenth of a second while an audit runs. And when the database can filter and sort a list itself, only the rows on screen leave it.
The measured figures
- Audits pause to let the screen respond. The deletion audit works in chunks, and no chunk runs longer than about 30 ms, well under the 100 ms where people notice lag. With 10,000 products on the till, a whole audit takes about 68 ms of work, spread over 17 or 18 pauses. With 50,000 products, under 300 ms.
- The first result stays quick while sync runs. The first results of a query still arrive in about 7–10 ms while a 10,000-product audit runs, and about 40–54 ms during a 50,000-product audit.
- Only the rows you can see leave the database, when the filter and sort can run inside it, so a screen update moves ten rows, not ten thousand. Searches, and filters the database can't run itself, are worked out on the till instead.
These figures come from the engine's performance tests, measured on one computer with the database in memory.
How these figures are measured
The tests run on an Apple silicon computer with the database in memory, and on their own in CI whenever the sync engine changes. Their limits sit about 11–18 times above the measured figures (3 times for the 30 ms chunk), and three times higher again in CI, so they catch a slowdown of that size, not a slow test machine.
Checked against a live store
The rules above are also checked on a real WordPress store, by hand, after a release is deployed: the till makes no audit requests before the product list first shows, and stays inside the audit's ceilings after that.
What the live test checks, and why it exists
The test reloads the POS with an audit due and checks that:
- the till makes no audit requests before the product list first shows, and
- after the minute's hold, the audit makes at most 9 summary pages and 2 detail requests.
The test came from a real regression: an early development build sent 41 detail requests (1.2 MB) in one audit when a till rebuilt its records. The design that replaced it checks summaries first and keeps detail requests under the ceilings above, and the engine's tests enforce those ceilings on every change.
What the numbers don't tell you
- How long a first download takes. That depends almost entirely on your server's response times and your catalogue size. In the tests, writing 10,000 downloaded products into the till's database takes under 10 ms; the network and the server take the rest.
- How much faster than WCPOS 1.x this is. The two designs differ too much for one number to be fair. How the Sync Engine Works lays out how they differ.
- What your own store will see. The test figures come from one computer with the database in memory. That's why the Performance tab shows what this till actually did in the last 24 hours rather than a forecast. Its data figure counts only answers that state their size, so it can read lower than the real traffic, even 0.0 MB.